StatsMonitor
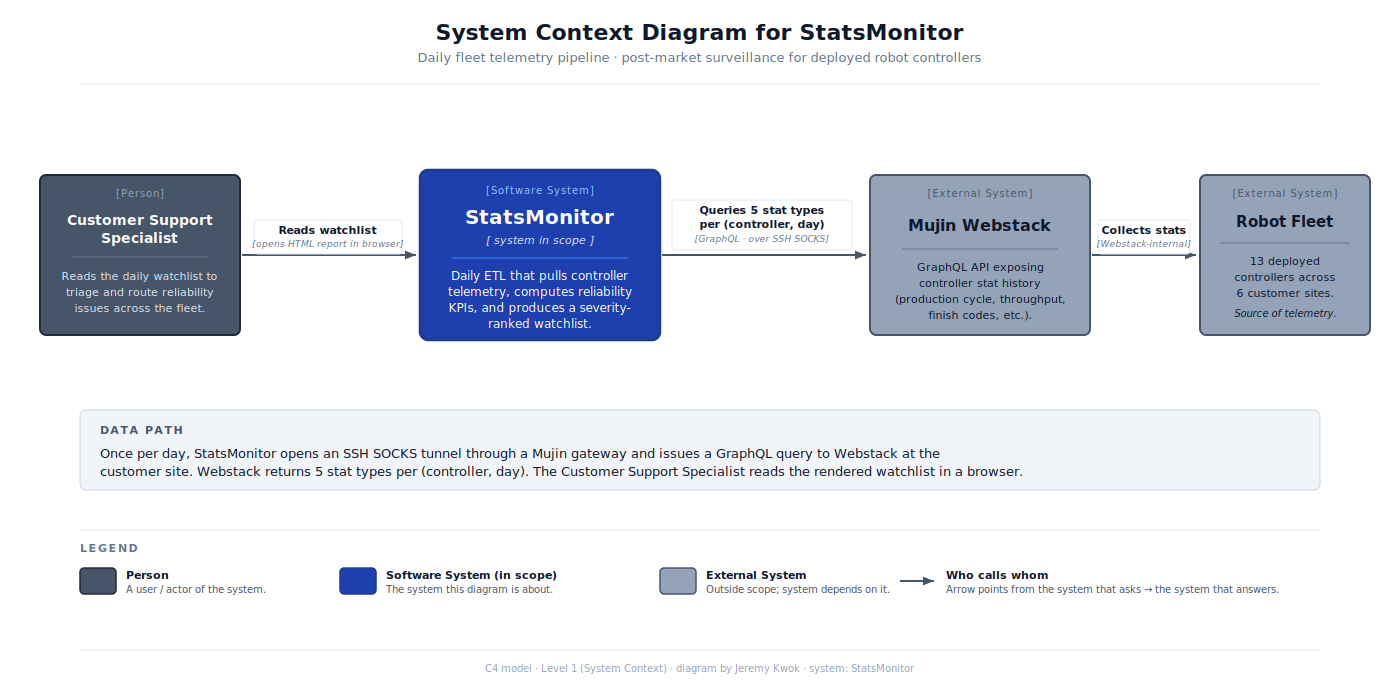
Daily post-market surveillance pipeline for a deployed 13-controller robot fleet across 6 production sites — turns raw controller telemetry into a severity-ranked, evidence-gated reliability watchlist.
Mujin Intern / Sole developer (end-to-end) · Feb 2026 – Apr 2026 · Team of 1
Contributions
Diagnosed a customer-reported production drop as a packaging defect breaking the vacuum seal, then authored an adopted SOP from the investigation
▾Result
Root cause identified as a packaging defect. The gripper was tearing the top of the customer's incoming boxes during pick attempts because the boxes had a hole on the top face that was breaking the vacuum seal. Findings reported to my manager and the customer support team. The EOAT Reliability Watchlist Operating Guide that came out of this work covers severity levels, watchlist categories, week-over-week trend badges, evidence-collection procedures, and escalation paths. The senior technical writer reviewed it, the customer support team adopted it, and I handed both the guide and its underlying pipeline off to a coworker before leaving the internship.
Designed a composite reliability risk score with peer-relative normalization and automatic driver attribution, replacing the prior single-metric ranking
▾Result
The watchlist surfaces controllers in severity order, top-down. Each row tells the customer support team three things at a glance: how severe (color), what kind of issue triggered it (driver category), and what to investigate (the SOP-defined recommended action). Because the score is peer-relative, "most extreme right now" is the natural sort key, and the team doesn't have to compare absolute thresholds across controllers operating in different conditions.
Built a week-over-week trend detection layer that surfaces controllers getting progressively worse, with noise-floor gating to prevent low-volume false alerts
▾Result
The watchlist now surfaces two complementary signals per controller: severity (which controller is the worst right now) and trajectory (which controllers are deteriorating). The customer support team uses both together. A "Degrading yellow" controller can take priority over a "stable red" one because the trajectory tells the team which problems are still actively unfolding. The trend badge feeds the same SOP-driven escalation paths as the severity color, so a controller showing Degrading for two consecutive weeks triggers a defined escalation step in the operating guide.
Designed the pipeline to refuse silent assumptions about missing or thin data, surfacing telemetry-quality issues as first-class watchlist signals
▾Result
The customer support team gets two clearly separated signals on each card. Severity (color and category) tells them whether the controller is unhealthy. Coverage tells them whether the data they're looking at can be trusted at all. A row of green and red squares on each card shows which days had required stats over the last 7 days, with a count below it. When a controller's data is unreliable, that surfaces as its own watchlist row pointing at the right team to investigate, not as a misleading performance signal. Time-breakdown bars and trend tables draw blanks rather than zeros where the data isn't there, so the report stays honest about what it knows.
Built reliability properties into the pipeline as design pillars, then hardened it in response to specific failures observed in production
▾Result
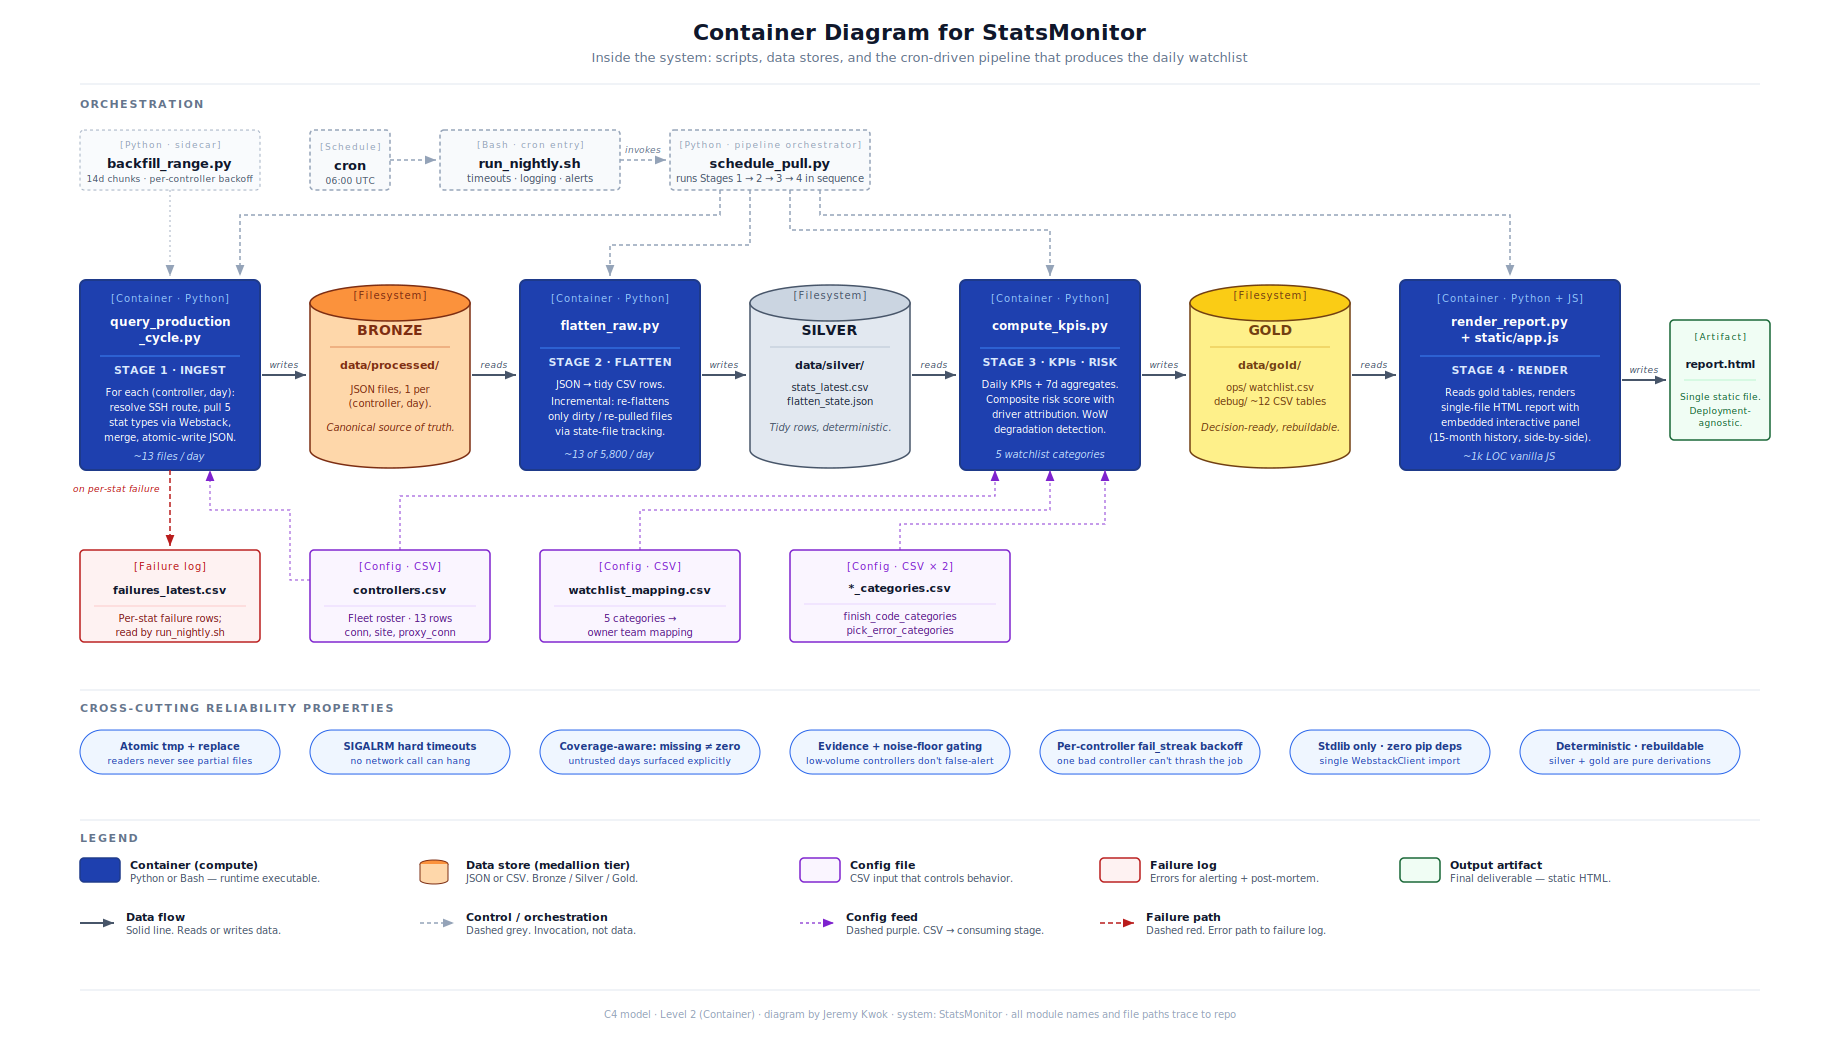
The pipeline runs nightly without intervention. Failures are non-fatal at the right granularity: a single bad controller is logged to a failure CSV and the rest of the run completes. Partial failures don't silently advance state and create gaps in the historical record. A killed process leaves a clean filesystem because the source-of-truth files are atomically written. The full historical archive is reconstructable because every downstream artifact is a function of bronze.
Built the interactive analysis panel that turns the static watchlist into a real investigation tool, with side-by-side controller comparison and 15 months of historical context
▾Result
The customer support team has both halves of a diagnostic system: an alert layer (the watchlist) that tells them which controllers to look at, and an investigation layer (the panel) that lets them actually look. The team has used the side-by-side comparison feature to compare two gripper systems against each other directly. The panel was also portable enough to carry into a separate project, where I used it during EOAT validation testing to compare a baseline suction cup against a new model under field conditions over multiple weeks.
Authored an operating guide for the watchlist as part of my handoff, and the customer support team adopted it for ongoing use
▾Result
The guide was adopted by the customer support team. My coworker mentioned wanting to put it up on a monitor in the office so the team can see all the controllers at once during their day. The guide is one of two things that made the system actually transferable when I left: the second was the codebase itself. I handed both to a coworker before my last day and made sure he had the pipeline running on his end. The system continues to surface anomalies on its own daily, and the team has a written playbook for what to do with them.
Interfaces
| From | To | Type | Description |
|---|---|---|---|
| Mujin Webstack GraphQL API | Bronze: raw JSON store | data | Per-controller, per-day pulls of multiple stat types via the Webstack client (vendored). Each controller-day produces one merged JSON file written atomically (tmp + replace). Provenance preserved via generatedAt timestamp on every file. Failures logged to a per-stat failure CSV rather than aborting the run. |
| Bronze: raw JSON store | Silver: tidy CSV store | data | Incremental flatten transforms nested controller-day JSONs into one row per (controller, day, stat). State-file tracking ensures only dirty or re-pulled files get re-flattened. Coverage signal preserved as a separate ledger so missing data stays distinguishable from zero-event days downstream. |
| Silver: tidy CSV store | Gold: KPI tables + watchlist | data | Daily KPIs computed (picks/hour, error-induced downtime share, interventions per 10k picks, finish-code and pick-error category distributions) per controller-day. Composite risk score and week-over-week trend classification computed over 7-day windows with evidence gating. Coverage gaps surface as their own watchlist category. Outputs include both ops-facing (watchlist) and debug tables for traceability. |
| Gold: KPI tables + watchlist | Single-file HTML report | process | Static HTML report rendered from gold tables, including the interactive analysis panel for self-service investigation. Daily refresh. Deployment-agnostic: the renderer writes to a known path, and the team layered hosting on top with no code changes. |
| Operating guide (handoff doc) | Customer support team workflow | process | The EOAT Reliability Watchlist Operating Guide translates the system's outputs into a deterministic playbook: severity actions, watchlist category investigations, trend-badge interpretation, escalation paths to specific teams, and key thresholds. Adopted by the customer support team during my handoff. |
Documents
Limitations
- • Pipeline depends on the upstream telemetry API contract staying stable. There's no contract-test layer that would catch a schema change before a daily run breaks.
- • Composite weights, evidence gates, and noise floors are tuned for the current fleet's failure patterns. They don't auto-adapt as the fleet grows or the customer mix changes.
- • Canonical bronze archive lives on a single host with no off-server backup. Atomic writes protect against in-process corruption, not against disk or server loss.
Lessons & Next Steps
- • "Most severe right now" needs more than one dimension when the operator is triaging multiple imperfect controllers at once. A composite score with driver attribution beats a single-metric ranking when failure modes are heterogeneous.
- • Data quality has to be a first-class signal in any system that drives decisions. Zero on a chart can't mean "no events" and "no data" interchangeably without misleading the reader.
- • Production reliability comes from iteration as much as upfront design. Several of the most important reliability features in the pipeline came from patching real failures, not from getting everything right on the first pass.